Project: Designing hackdays
This November, I’ll be facilitating a hackday of journalists, coders and various concerned citizens to find stories about EU migration. We hope to use datasets, like the Migrant Files, and other types of content as we dig for new angles on the intensifying topic of migration into and throughout the continent.
The event will be part of the Berliner Gazette’s Slow Politics conference, alongside a number of other productive sessions. A clear exposition of the themes will be published soon.
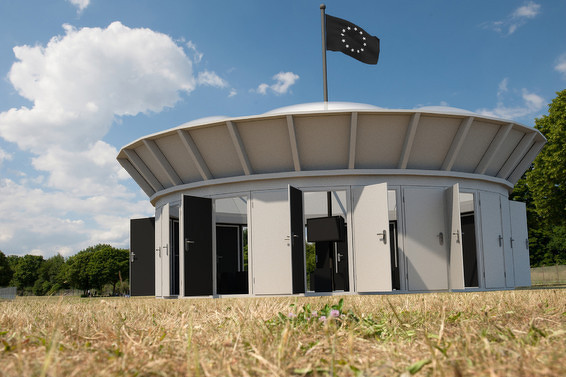
An exhibition at Berlin's Tempelhof remembers those lives lost at Europe's borders.
As we prepare to take on this delicate issue, we will devise a process to make the session smooth and effective. Hackdays, or whatever we should call such a gathering, often hold great promise, but can suffer from uncertainty as they aspire to achieve rounded results in short time.
There is also the matter of managing data and turning it into an accurate, accessible whole.
This post is an attempt to bring together concerns, best practice, tools, examples and discussion as we design our approach. I aim to keep the attention of less technical readers too.
There are so many ways of working and a good hackday will typically remain open and adaptable to anything people bring along. However, setting out one clear process can guide expectations, align methods and ensure technical resources are at hand.
I hope the suggestions we arrive at through this discussion will help us share foundations with participants in advance of the event.
Please add your thoughts as annotations with the grey sidebar on the right or feel free to get in touch with any suggestions.
Objectives
It’s not always clear what’s desirable and possible at an event like this. Our overarching objective is to produce compelling digital stories on EU migration.
I start by taking inspiration from a project already in circulation. The Migrant Files is an excellent piece of open-source data collation. One way this has been put to use is with a map illustrating the volume of immigrant casualties across the EU.
Technically, this is done by importing the data, as a spreadsheet, into CartoDB which then allows for column data to be represented according to geocoding inside the spreadsheet.
Technical step-by-step (as drop-down or sidebox?)
It’s a quick and simple way of depicting the numbers in an elegant way. It is also an easily embeddable product which allows a story to travel, as visible from another CartoDB instance which earned Greenpeace a little bit of visual authority in the eco-intolerant Daily Mail.
Showing things differently
A graphic like that above would be a great outcome. Our working group has also considered other approaches to the task, from the data-driven, to the satirical, to the fantastical.
One proposal is Spot the Migrant, an interactive quiz which presents a number of images challenging the user to spot the immigrant in each image. The site could even include on-click audio to add a voice to the face. The intention is to challenge perceptions of what type of people are actually immigrants. Stereotypes continue to cause huge damage whilst also being so confused as this would surely illustrate.
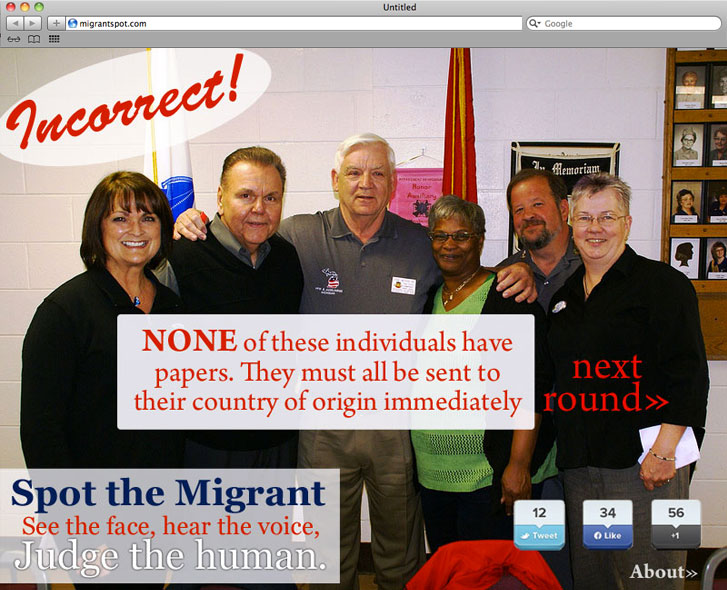
One artist's vision of migrant identification game Spot the Migrant. Image CC SONY DSC
There are a thousand ways to tell a story and a thousand stories to tell. What we come up with partly depends on the material we have to work with (see below), but also the wealth of creativity. We’ll be collecting ideas, like those above, in the coming months, including here and now.
Here’s a spreadsheet for participants or anyone else reading this to contribute relevant ideas, new or already online, for our use at this event or at another time or place. I’ll add a link to the thematic brief for more context as soon as it’s available. Please add your inspiration.
Content collation
We have so far looked at a couple of different content types as the basis for our projects. It’s important that whatever material we have on the day is fertile, orderly and accessible.
It is not clear yet which will be our primary sources. One option is the Migrant Files, an example of a highly relevant, geocoded dataset documenting casualties and injuries of immigrants in transit. With more work, it might yield findings or clues not yet known. We may be able to work with that as it is. We may also attempt to build on that dataset, by seeking data using similar open-source techniques as its creators, Journalism++, employed, or by making Freedom of Information requests at the EU or regional level, or by other means.
There may be other datasets of different sorts which could lead to further important findings. It remains a live question what other data is out there, both that which is already compiled and that which might come of investigation, freedom of information, etc.
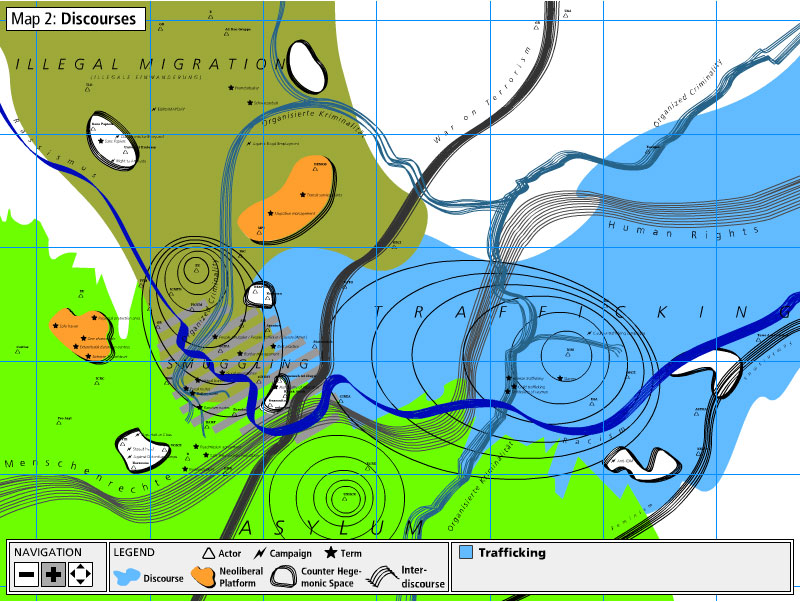
One of MigMap's critically charged migration configurations.
Alternatively, one team might choose to refine or codify data as their overall contribution. We were recently treated to a presentation by MigMap co-creator Peter Spillmann. Among MigMap’s many extraordinary cartographic perambulations is a neat timeline of EU policy events affecting migration. One project may be to take the findings made by MigMap’s researchers into a dataset for others to see and use. It’s not obvious that such a clear spread of the policy trails that made fortress Europe exists anywhere for people to feast on.
Another angle entirely would be to gather open-licensed qualitative, narrative, pictorial and other material together to allow for different kinds of story-telling. A strong image bank, a themed collection of Tweets, anecdotes gleaned from the streets of Berlin…
This approach has been emphasised by those who feel that the palpably human dimension of this issue is understated in some of the reporting, yet that is crucial to conveying the reality.
The question of what material to focus on will be decided as the conference themes develop and our current avenues of investigation unfold.
Participant pairing
Skills, interests, resources they bring (hosting?)
If possible, have participants outline their skills and interests in advance and perhaps organise accordingly.
Format of the event
Hackdays come in all shapes and sizes. It is too early to make an exact agenda for our two and a half day event. That will depend, among other things, on the sort of people and projects that arise.
Hackday format? Timetable?
Tools and tech resources
When it comes to sharing resources, crunching data, coding a public face and hosting it all, the more options are ready to go in advance, the more likely technical production will run smoothly. Here’s a list of services, with accounts all ready, fulfilling many common hackday needs.
Data Hosting
github, Bitbucket (free hosting of code that needs to be private), ckan, google
Web site hosting
heroku, strikingly
Domains
namecheap
Quick design
Hackdash.org